
Grid cell counts
Description
The grid cell count method integrated in photoQuad is commonly found in the literature as the "visual method" or "visual estimation method", and can be used to quickly estimate percentage coverage of organisms and associated substrate. In the traditional "visual" approaches, a larger quadrat is broken down into smaller squares, and percentage coverage is subjectively attributed to an organism according to its contribution in "filling up" each square. The photoQuad software implements the "visual" methods in the digital domain, providing a versitile, fast, and semi-automated approach.
Highlights
Grid cells operate on a separate layer
Grid cell size is fully customizable, and expressed either in pixels or cm2 units (if image is calibrated)
Grid cell canvas can be automatically confined within the quadrat's active area
Grid cells are automatically partitioned when output descriptors are calculated: for each particular grid cell, only the portion that lies within the quadrat's active area contributes to the exported area or coverage.
Read more: | Overview | Grid configuration | Activating grid cells | Grid cell partitioning |
| Descriptors and worksheet output | Known limitations | FAQs |
During "visual" surveys, quadrats are often sectioned off to make coverage estimation easier, using either some pins and rope to create a more refined sampling grid. The researcher goes through each small square, adding up the respective percentage cover to get the total estimate.
The photoQuad software implements the same principle in its digital counterpart, where the option of a custom elementary sampling unit is provided, and the direct estimation of species area (next to species coverage) is also automatically performed. Furthermore, accuracy is increased, because should an active grid cell falls partially within the quadrat's active area, the software automatically partitions its contribution and uses the within-quadrat portion of the cell for area and coverage calculations.
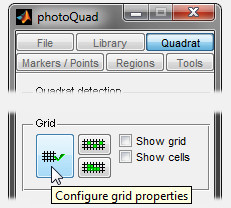
The grid cell tool is hosted in the Quadrat tab of photoQuad's floating GUI; for menu-based controls, go to to the image analysis window, and then: View/Configure grid properties.
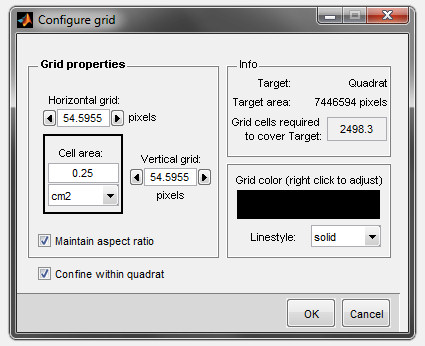
The grid can be fully parameterized using the configuration window shown in the image below. Available options include cell size, aspect ratio, color, linestyle, and whether the grid is spawned over the whole image, or is automatically confined within the quadrat's active area. Note that cell size can be set either by directly defining its area, or by fine-tuning the horizontal and vertical sides. If the image has not yet been calibrated, only pixel units are available.
Some of the possible grid configurations are shown below:
the grid can be confined within the quadrat

the grid can be loose
the grid can be small
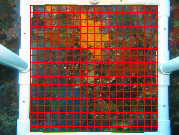
the grid can be big
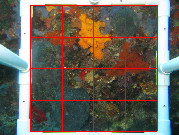
..while having any aspect ratio

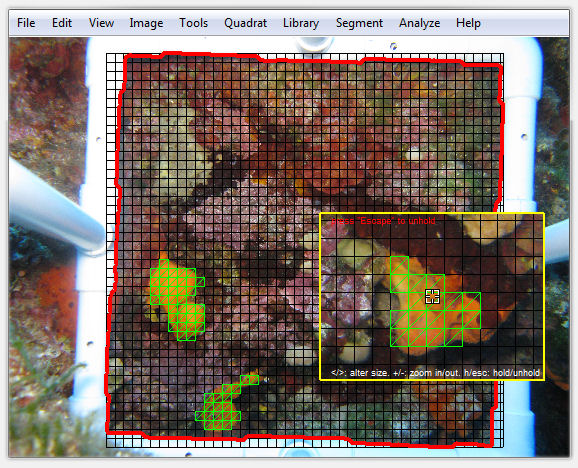
Once the grid is configured and spawned, each elementary cell can be individually activated. Cells can be toggled on and off (i.e. set to active/inactive mode) using either one of the following tools:
Note: only active cells contribute to the exported area and coverage measurements.
1) single-cell toggle mode
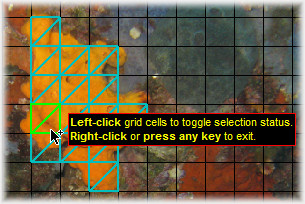
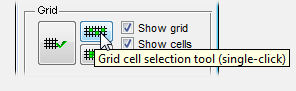
In this mode, grid cells function as toggle buttons, and only a single cell can be activated/deactivated per click.
2) drag-and-select mode
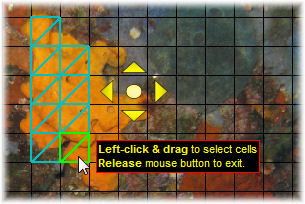
Use the drag-and-select mode to activate a series of adjascent grid cells. In this mode, the mouse pointer functions as a cell selection brush.
Note: Currently, cells can only be activated using this tool. To deactivate cells, use the single-cell toggle tool. Read more known limitations..
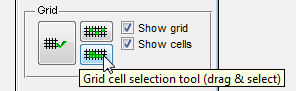
Controlling grid cell visibility
Using the above image as an example, use the "Show grid" and "Show cells" checkboxes to independently toggle the grid and cell visibility respectively.
You can also control the visibility through the Layers tab. Please note however that only the activated cells can be controlled from there, since these are the actual analysis objects.
As described in detail here, photoQuad is constantly monitoring the existance and status of the defined quadrat, and automatically adjusts the output statistics relative to the active sampling area (i.e. the portion of the image that is inside the quadrat).
The same principle applies to grid cell statistics: should an active grid cell falls partially within the quadrat's active area, the software automatically partitions its contribution and uses the within-quadrat portion of the cell for area and coverage calculations. This not only increases the measurement's overall accuracy, but also frees the user from having to meticulously select the grid cells that lie close to the quadrat's boundary. You just have to select the cells, and let photoQuad do the maths; please refer to the following example:
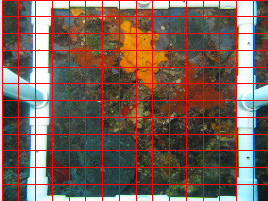
The image below shows a typical grid cell analysis example, using an elementary cell unit of 0.2 cm2. There are 9 active cells in total, 4 of which are within the quadrat (as defined by the red line), 3 cells are intersecting the quadrat, and 2 cells are completely outside the active sampling area. If photoQuad just summed the area (or coverage) of the active cells, the result would erroneously be:
Atotal = 0.2 x 0.9 = 1.8 cm2
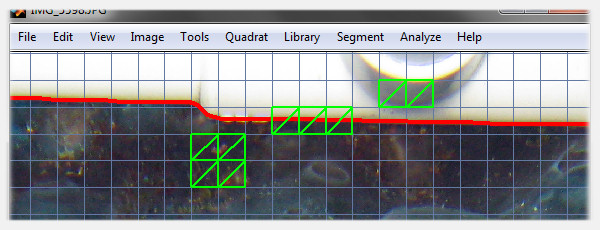
As the following image illustrates, the software is a little more clever than that. It automatically partitions each intersecting cell, calculates the area for that cell that is within the quadrat, while completely ignoring the cells that fall outside the quadrat. Whis way, the result is correctly reported as:
Atotal = 1.124 cm2
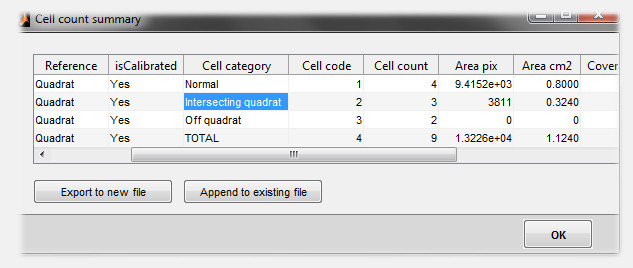
For each grid cell analysis session, 4 (four) lines with the following descriptors are exported, comma separated (*.csv). The fisrt 3 lines contain the statistics of each cell category (Normal, Intersecting quadrat, Off quadrat), while the fourth line holds the TOTAL information; read about cell categories here.
Note: only active cells contribute to the exported area and coverage measurements.
| Descriptor | Units | Definition |
| Image | text string | Image filename |
| Path | text string | Image directory path |
| Reference | text string | The object to which coverage is referenced to. If a quadrat has been defined, its value is "quadrat"; if not, its value is "image" |
| isCalibrated | text string | It is either "yes" or "no", depending on whether the image was calibrated the moment descriptors were exported |
| Cell category | text string | The value is one of the following: Normal, Intersecting quadrat, Off quadrat, TOTAL; read about cell categories here |
| Cell code | - | Depending on Cell category (Normal, Intersecting quadrat, Off quadrat, TOTAL), the value is 1, 2, 3, 4 respectively |
| Cell count | - | Total number of cells per category |
| Area pix | pixels | Total area of active grid cells, expressed in number of pixels |
| Area cm2 | cm2 | Total area of active grid cells |
| Coverage % | % | Percentage coverage of active grid cells (max 100%) |
| ref Area pix | pixels | Reference area, i.e. the area expressed in number of pixels of the object to which coverage is referenced to. If a quadrat has been defined, it is the area of the quadrat; if not, it is the area of the whole image (Height*Width) |
| ref Area cm2 | cm2 | Reference area, i.e. the area of the object to which coverage is referenced to. If a quadrat has been defined, it is the area of the quadrat; if not, it is the area of the whole image |
| Unit cell area pix | pixels | The area of the elementary sampling unit, i.e. the area of a single grid cell, expressed in pixels |
| Unit cell area cm2 | cm2 | The area of the elementary sampling unit, i.e. the area of a single grid cell |
..read more on worksheet output
Important !
When exporting your data, make sure that the target file is not simultaneously opened in Excel or in another application.
Excel takes hold of the file and prevents other applications from having write-access to it, so photoQuad will not be able to export the requested data. If this happens, you will receive a message saying so. Please close the target file from Excel and repeat the export.
In photoQuad's current release, the grid cell tool is probably the least customizable analysis option. There are some known limitations, which we'll fix in an upcoming version:
Grid cells can be assigned to one species only.
The interface can become sluggish (slow) if a large number of grid cells are activated.
Details
1. Contrary to any other photoQuad analysis tool, grid cells cannot be assigned to more that one species per session. This means that you cannot activate 10 cells, and assign 7 cells to species A and 3 cells to species B. All activated cells refer to one species only.
Should you require to analyze more than one species per image, follow these steps: a) Spawn a grid with custom properties; b) activate as many cells needed to cover species A, export the statistics, and save the layer as e.g. "IMG_1234_speciesA"; c) delete all previous active cells, activate some new ones to cover species B, export the statistics and save your work as a new layer, e.g."IMG_1234_speciesB". Repeat as necessary for all species to be analyzed, and manually merge the export file. Yes, it is not very convenient, but it works..
2. As the number of activated cells increases, you will notice a gradual degradation in the software's response. This is more probable to happen when you try covering a very large image feature while using a very small grid cell size. We will correct this issue in an upcoming version, but until then the problem exists. As a workaround, if you want to measure a large image image feature using grid cells, please avoid using a very small elementary grid size. Even better, use another analysis method that is more suitable for large image features (species regions, image segmentation, or random point counts)..
Can I reconfigure the grid properties while some grid cells are already activated?
Yes, the grid can be reconfigured at anytime. Note however that active cells depend on the underlying grid, so photoQuad will spawn a question dialog asking permission to delete any active cells before reconfiguring the grid.
Can I analyze more than one species at once using grid cell counts?
Not in the current photoQuad version; currently only one species can be analyzed per grid session. We will fix this in an upcoming release, until then look here for a workaraound.
How can I delete some active grid cells?
Launch the single-cell toggle tool and click on the selected cells to deactivate them. To delete all cells, right-click any cell and select "Delete all cells".
Why does the interface become sluggish (slow) when I activate a large number of grid cells?
Please read the known limitations section. Regardless of that, you are probably using a very small elementary cell size and try to cover a very large image feature; consider increasing the cell size if this is the case, so that fewer cells are needed to cover the object.
Can I toggle the grid's visibility on/off?
Yes. Use the "Show grid" and "Show cells" checkboxes in photoQuad's floating gui to independently toggle the grid and cell visibility respectively. You can also control the visibility through the Layers tab. Please note however that only the activated cells can be controlled from there, since these are the actual analysis objects.
Can I detect/define the quadrat after creating the grid?
You can, but please don't. If you are analyzing an image that contains a quadrat frame and you want the grid to be confined within it, please detect the quadrat before spawning the grid.
