Getting started
Welcome to photoQuad's Features and Documentation section, which will introduce you to some key tools and analyses supported by photoQuad. You may want to check out the image gallery below, see some highlight features on this page, or browse through the side menu for more.

Layer-based analysis


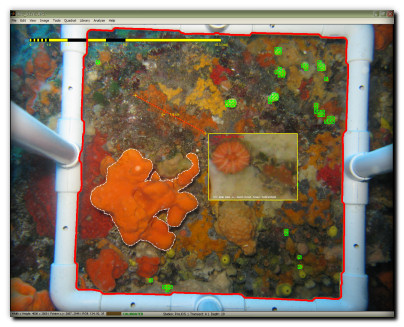


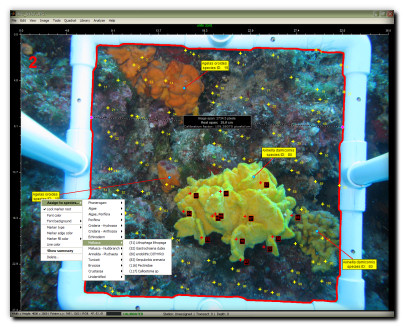


Hover mouse over blobs to preview images
photoQuad's non-linear manners
An important characteristic of photoQuad is its underlying architecture that enables a non-linear manner in data exploration and analysis. To put it simple, the user does not have to bother with a particular order in which the analyses must be performed, nor follow a strict series of steps when preparing the data. Analysis objects and their descriptors are dynamically calculated and referenced to the quadrat active area, each time the quadrat is defined, its outline modified, or image calibration marks are set or altered.
You may have marked a series of species regions, but forgot to detect the quadrat, or calibrate the image; at this point, region coverages and relevant descriptors are referenced to the whole image area, and area or distance units are expressed in pixels. Calibrate the image at anytime, and descriptors switch to metric units. Detect the quadrat or modify its outline, and coverages are automatically referenced to the quadrat's active area.
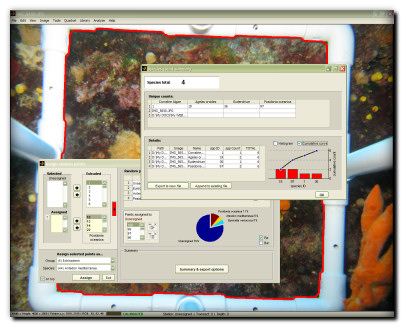
photoQuad operates in a layer-based environment that allows multiple analyses to be performed simultaneously on the same source image. Layer-based objects include segmentation boundaries, regions of interest, species count markers, grid cell counts, random points, measurement tools, and species region area/coverage estimation objects.
Working in layers reduces analysis time and simplifies data management: all you need to reproduce the results is the input image and photoQuad's native layer file (*.pqd), which can be saved, loaded or modified at anytime. | ..more
photoQuad integrates a wide range of analyses, all of which operate on a distinct layer, can be applied simultaneously on the source image, and are further supported by direct ASCII worksheet output:
Species counts
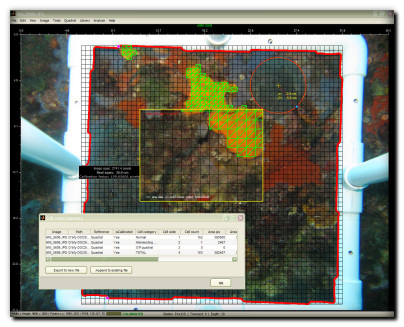
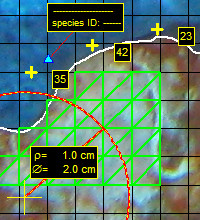
Grid cell counts for approximate area and coverage measurement
Random point counts (random-, stratified random-, or uniform-distributed)
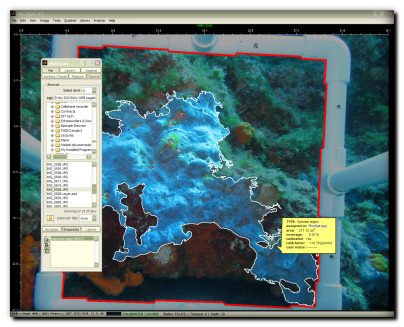
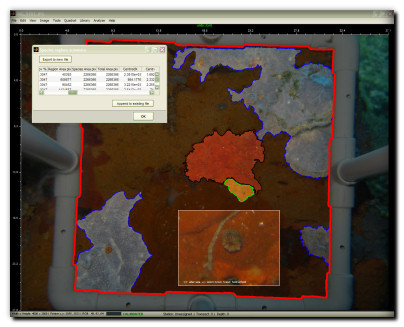
Species regions for precise area, coverage, and perimeter measurement
Extraction of advanced 2D morphometric descriptors such as centroid, perimeter roughness, equivalent diameter, bounding ellipsoid, or orientation
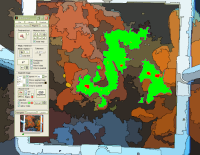
Multi-scale image segmentation
Annotation and user-notes tools
Image calibration and distance/area measurement tools
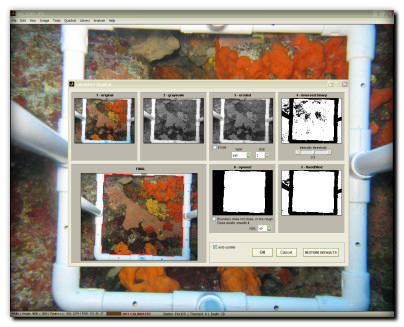
Outlining the quadrat boundary is a common process in photoquadrat sampling, used to define the effective sampling area and to calculate coverages or related descriptors. This mandatory, but repeated, process gets really simplified in photoQuad, using its "click-and-detect" feature.
Using some background image processing tricks such as binary conversion, erosion, intensity threshold, and structuring element decompositions, photoQuad is able to automatically detect the quadrat with a single click. Post-detection corrections can be applied, while a series of tools are there to optionally draw a manual quadrat outline, or select an outline out of some predefined noded shapes. | ..more
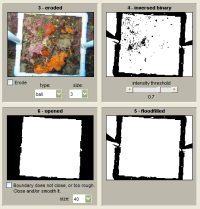
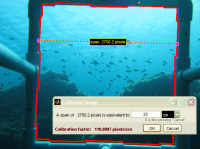
Image calibration provides a pixel to real-distance conversion factor (i.e. the calibration factor, pixels/cm), that allows image scaling to metric units. This is achieved by simply placing photoQuad's calibration marks on two points that are a known distance apart, and entering the actual distance spanned by the points in centimeters.
Note that an image can be recalibrated during analysis without work loss. If analysis objects such as region outlines are defined prior to image calibration, their descriptors are expressed in pixels, and conversion to metric units is automatically performed upon calibration; both unit options are always exported to the final analysis worksheets, plus image calibration metadata | ..more
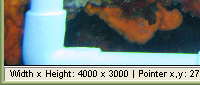
Photoqraphic sampling of benthic communities often requires high-resolution camera settings; photoQuad supports the direct import and analysis of high-resolution images (typically 4000x3000 pixels), without the need to manually downsample them prior to analysis. | ..more
The user-defined species library is a core component to photoQuad's functionality, allowing the association of various object properties to particular species. The library can be an MS Excel (*xls) or a typical comma-separated ASCII file (*.csv), it can be imported or modifed at anytime, while custom tools are provided for adding new species entries during data analysis and exploration. Multiple species libraries are supported per user.
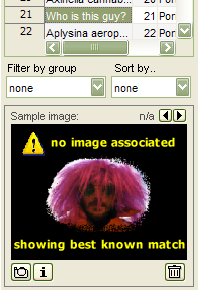
photoQuad is further equipped with a species preview image association tool, that allows a custom image region, or multiple regions from different images, to be associated to a particular library entry. The next time you click on a library entry, the associated preview images are displayed, including the source image metadata.
A demo library is also embedded to get you started. | ..more
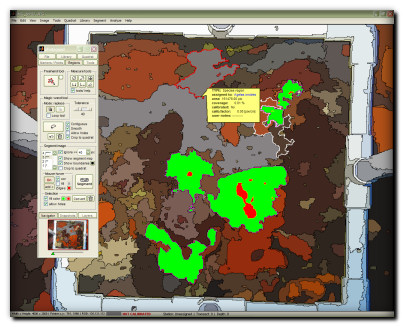
Segmentation is the partitioning of an image into multiple sets of pixels that share some common visual or computed characteristics, such as color or intensity. photoQuad is equipped with a powerful algorithm that sequentially segments the image into 4 different scales from coarse to fine detail, facilitating the automatic location of objects and boundaries, and the transformation of the input image into a "segment map" that is easier and faster to analyze, in a user-independant manner. | ..more