
Species regions
Description
Species region analysis refers to the drawing of an outline around a specific image feature, its association to a particular species library entry, and the subsequent extraction of region descriptors regarding its area, coverage, perimeter or other morphological information.
Highlights
Regions operate on a separate layer
Regions can be edited, moved around, or rotated during analysis
Regions can be reassigned to a species or reverted back to unassigned Regions Of Interest (ROIs)
Region descriptors are automatically updated each time the quadrat boundary, the calibration data or the region itself is modified
A range of advanced morphometric region descriptors is calculated, including centroid, perimeter roughness, bounding ellipsoid, orientation or bounding box
Region area and coverage are exported at individual level, species level (cumulative per species), and quadrat level (grand sum total per image)
Read more: | Object hierarchy: from Regions Of Interest to Species Regions and vise-versa |
| Drawing a region of interest | Editing and customizing | Assign to species |
| Automatic update of region descriptors | Region descriptors and worksheet output |
| Things to avoid | FAQs
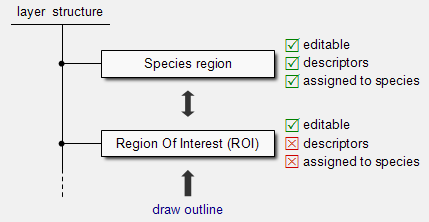
When working with regions in photoQuad, it is useful to have an understanding of the hierarchy that the software uses in order to manage these objects.
A region may either be a simple Region of Interest (ROI) or a Species region; from the user's perspective, what makes the difference here is whether the region has been associated to a species or is simply left unassigned. For the system however, a region's status determines the amount of information that the software attaches to the region, and must thereby also monitor in real-time.
1. Create a region
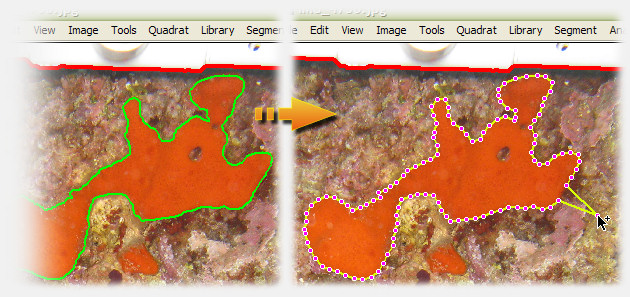
Regions can be defined in photoQuad either in a manual manner using freehand drawing tools, or be traced automatically using photoQuad's multi-scale image segmentation algorithm. Whichever the case, the result is a closed polygon superimposed on the image.
2. It is a Region of Interest (ROI)
Just after defining a region, photoQuad considers it as a polygon that just sits on the image, doing what polygons on images do: they only indicate a feature that potentially is of some interest to the user. photoQuad does not waste system resources on extracting advanced descriptors for ROIs, and also ignores ROIs in the exported analysis worksheet.
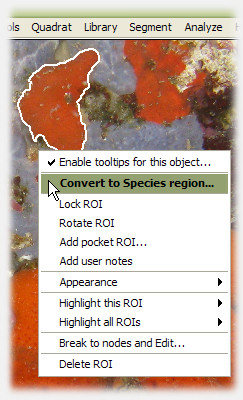
3. Assign a ROI to a species, and it's promoted to Species region
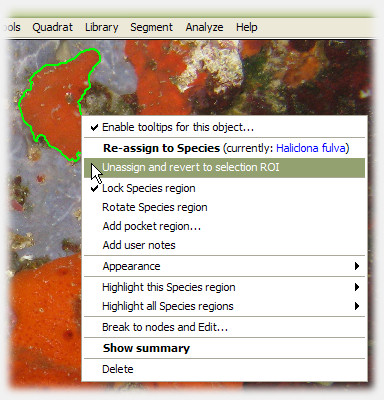
Anytime during analysis, the user can right-click a ROI and assign it to a particular species. The ROI is promoted to a Species region, and photoQuad immediately calculates a series of descriptors that are automatically updated each time the quadrat boundary, the calibration data or the species region itself is modified. The user can change their mind anytime, unassign a Species region, which is then automatically reverted back to the ROI category.
define an outline,
and it's a Region Of Interest (ROI)
assign it, and it's a species region;
unassign it, and it switches back to a ROI
ROIs and Species regions operate independently on separate layers, they are both editable during analysis, and there is no restriction on the number of objects contained per category.
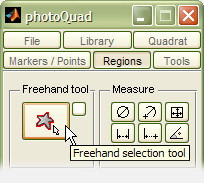
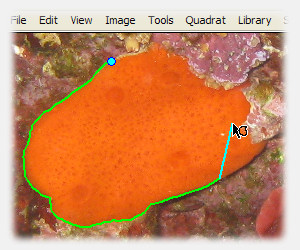
Click the button with the starfish icon on photoQuad's floating GUI to start drawing a freehand region of interest.
A root node appears under the mouse pointer. Left-click anywhere on the image to anchor the root node, and the following drawing process is pretty much intuitive: left-click to add new nodes, left-click and drag to draw a continuous line, press the "backspace" or "delete" buttons to undo, and right-click or press "return" to finalize the selection. The polygon closes automatically and is registered as a new ROI.
drawing a region of interest
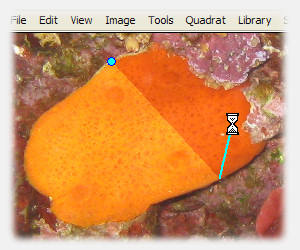
press "s" while drawing to preview result
The following keyboard shortcuts apply while manually drawing a region:
| s | preview region if finalized at current node |
| backspace | delete | delete most recent node (applies sequentially down to the root node) |
| h | toggle region help message |
| +/- | zoom in/out |
| keyboard arrows | pan image |
| space | reset zoom/pan (center image) |
| c | change region color |
| m | toggle region markers |
| < > | increase/decrease region linewidth |
| p | shrink mouse pointer |
| return | submit region |
| escape | cancel and delete region |
Please note that next to the above keyboard controls, image canvas position and zoom level can both be adjusted using the navigator panel.
photoQuad's ROIs and species regions are fully editable objects and remain such throughout the analysis process. Just right-click a region and select an appropriate customization or editing option.
regions can be broken to nodes and modified
regions can be rotated
regions can be dragged
regions can be highlighted
Note that region descriptors are automatically updated each time the quadrat boundary, the calibration data or the region itself is modified. No matter when you request for a summary report and worksheet export, you will always get the updated information.
To associate a region of interest to a particular species, right-click it and select "Convert to Species region". A floating window linked to the current species library appears, and can be used to select the appropriate entry. If no species library has yet been imported, photoQuad will prompt for one or suggest to use the embedded library.
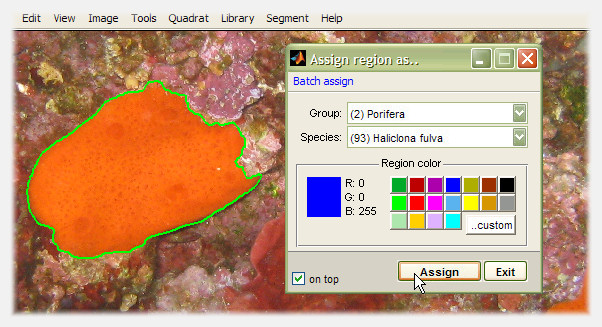
The species assignment window can remain visible so that multiple regions can be assigned in a sequence; just enable the "on top" checkbox on the bottom-left window corner.
Batch assign regions
To assign multiple regions with a single-click, use the "Batch assign" menu on the species assignment window (image above). Two options are available:
Batch assign all ROIs: This will assign all unassigned Regions of Interest (ROIs) to the selected species. There is no confirmation dialog, click and it's done.
Batch assign all ROIs and Species regions: This will assign every region on the image regardless status (i.e. both ROIs and Species regions) to the selected species. Obviously, the current Species regions will be modified, so photoQuad will request for confirmation.
photoQuad makes sure that species regions and their descriptors are dynamically recalculated after each modification, without user intervention. Regions are updated and referenced to quadrat's effective sampling area each time the quadrat is defined, its outline modified, or image calibration marks are set or altered. In the absence of a defined quadrat, relative-to-quadrat descriptors are referenced to the whole source image, and effective sampling area becomes equal to the whole image area. If species regions are defined prior to image calibration, their descriptors are expressed in pixels, and conversion to metric units is automatically performed upon calibration. Modify an existing species region, and its descriptors are automatically updated according to its new outline.
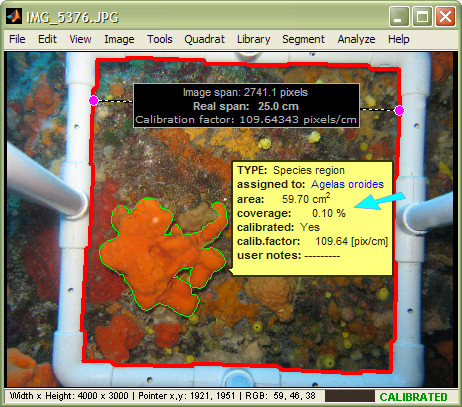
This means that no matter when you request for a summary report and worksheet export, you will always get the updated information. Please read this section for details, or take a look at the following illustration, that shows the automatic update of region descriptors after modification of the quadrat:
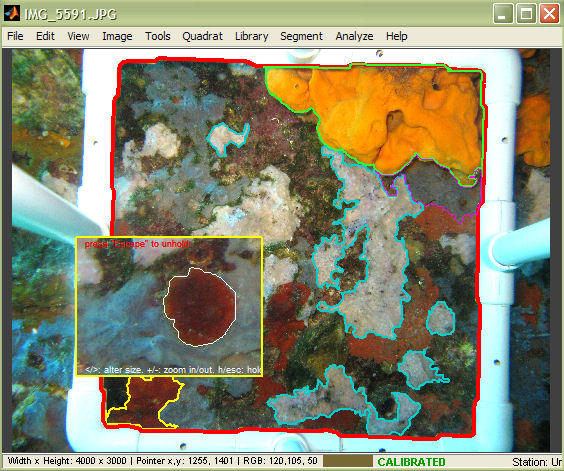
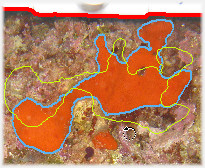
In this image, the quadrat was detected, the image was calibrated, and a species region was drawn. The tooltip shows two of the region's main descriptors: 1) absolute area, and 2) percentage coverage. Note that when (and if) a quadrat is detected, photoQuad calculates region coverage as the percentage ratio of the region's area over the quadrat's area.
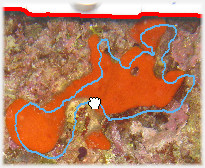
... the quadrat is modified...
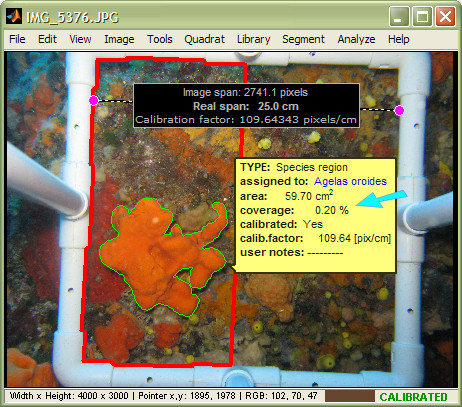
Here, the quadrat has been modified to half its size, but all other objects are in their original state. Note that region coverage has been recalculated automatically relative to the new quadrat. However region area is the same, since neither the region's outline nor the image's calibration factor were altered.
The basic output descriptors extracted from species regions are region area A (cm2) and coverage C (%), which are both automatically exported at: 1) individual region level, 2) species level, grouping all regions assigned to the same species, and 3) total image i.e. summing all regions together irrespective of species.
When a region is initially spawned, its area is determined by the number of pixels Apix contained within its boundary. Once the image is calibrated, photoQuad converts region area to cm2 units according to:
A = Apix * fclb-2
, where fclb is the calibration factor. Region percentage coverage is then calculated as:
C = (A/Aeff) *100
, where Aeff is the effective sampling area, which is either the area defined by the quadrat's boundary, or the area of the whole image if a quadrat has not been defined. These conversions apply automatically, as described in the previous section.
Furthermore, individual region output includes several advanced morphometric 2D descriptors including perimeter, centroid i.e. geometric center coordinates, or perimeter roughness.
To access the summary report just right-click a species region and select "Show summary". The report window looks something like this:
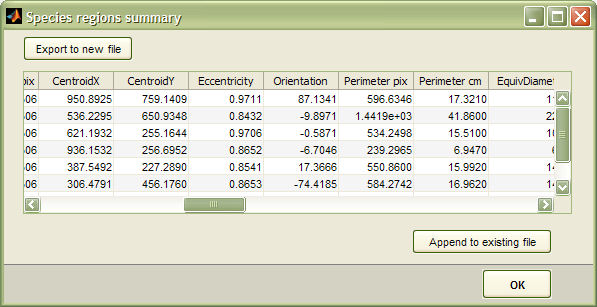
For each species region, a line with the following descriptors is exported, comma separated (*.csv)
| Descriptor | Units | Definition |
| Image | text string | Image filename |
| Path | text string | Image directory path |
| Reference | text string | The object to which coverage is referenced to. If a quadrat has been defined, its value is "quadrat"; if not, its value is "image" |
| isCalibrated | text string | It is either "yes" or "no", depending on whether the image was calibrated the moment descriptors were exported |
| sppName | text string | Species name that the region is associated to |
| sppID | - | Numeric ID of the species that the region is associated to |
| REGION Area cm2 | cm2 | Region area |
| SPECIES Area cm2 | cm2 | Cumulative area of all regions associated to this species |
| TOTAL Area cm2 | cm2 | Total area assigned, summing all regions irrespective of species |
| REGION Cov % | % | Region percentage coverage |
| SPECIES Cov % | % | Cumulative percentage coverage of all regions associated to this species |
| TOTAL Cov % | % | Total percentage coverage assigned, summing all regions irrespective of species |
| REGION Area pix | pixels | The actual number of pixels in the region, ignoring the conversion to cm2 |
| SPECIES Area pix | pixels | Cumulative area of all regions associated to this species, expressed in number of pixels |
| TOTAL Area pix | pixels | Total area assigned summing all regions irrespective of species, expressed in number of pixels |
| CentroidX | pixels | The x-coordinate of the region's center of mass expressed in pixels, counting from the image's left side |
| CentroidY | pixels | The y-coordinate of the region's center of mass expressed in pixels, counting from the image's top-left corner |
| Eccentricity | - | The eccentricity of the ellipse that has the same second-moments as the region, i.e. an index of how elongated the region is. The value is between 0 and 1: an ellipse whose eccentricity is 0 is actually a circle, an ellipse whose eccentricity is 1 is a line segment |
| Orientation | degrees | The angle in degrees [-90 to 90] between the image's x-axis and the major axis of the ellipse that has the same second-moments as the region |
| Perimeter pix | pixels | The distance around the boundary of the region, expressed in pixels |
| Perimeter cm | cm | The distance around the boundary of the region |
| EquivDiameter pix | pixels | Equivalent diameter, i.e. the diameter of a circle with the same area as the region, expressed in number of pixels. Computed as sqrt(4*Area/pi) |
| EquivDiameter cm | cm | Equivalent diameter, i.e. the diameter of a circle with the same area as the region. Computed as sqrt(4*Area/pi) |
| perimRoughness | % | Perimeter roughness, i.e. the coefficient of variation of the distance (Dc) in all directions between the region's boundary and its centroid. Computed as (stdev(Dc)/mean(Dc))*100. A region with rough perimeter would normally have a higher index compared to a smoother region. |
| PerimOverArea | cm-1 | Perimeter over Area, i.e. the ratio of the region's perimeter over its area (P/A). Regions with elongated shapes or indented perimeters have higher P/A ratios than regions of the same area with compact shapes. Small regions generally have higher P/A ratios than large regions |
| BoundingBox Area pix | pixels | Bounding box, i.e. the area of the smallest rectangle that is able to fully contain the region, expressed in number of pixels |
| BoundingBox Area cm2 | cm2 | Bounding box, i.e. the area of the smallest rectangle that is able to fully contain the region |
| MajorAxisLength pix | pix | Major axis length, i.e. the length in pixels of the major axis of the ellipse that has the same normalized second central moments as the region |
| MajorAxisLength cm | cm | Major axis length, i.e. the length of the major axis of the ellipse that has the same normalized second central moments as the region |
| MinorAxisLength pix | pixels | Minor axis length, i.e. the length in pixels of the minor axis of the ellipse that has the same normalized second central moments as the region |
| MinorAxisLength cm | cm | Minor axis length, i.e. the length of the minor axis of the ellipse that has the same normalized second central moments as the region |
| ref Area pix | pixels | Reference area, i.e. the area expressed in number of pixels of the object to which coverage is referenced to. If a quadrat has been defined, it is the area of the quadrat; if not, it is the area of the whole image (Height*Width) |
| ref Area cm2 | cm2 | Reference area, i.e. the area of the object to which coverage is referenced to. If a quadrat has been defined, it is the area of the quadrat; if not, it is the area of the whole image |
| user notes | text string | Any custom notes that the user has attached to the species region during analysis |
..read more on worksheet output
Note:
Next to the descriptors shown in the table above, the export contains 16 more columns named "dummy", populated with 0 (zero) values. Please ignore these columns during your statistical analysis.
We have left them there for forward-compatibility with a future version of photoQuad. We are planning to add more morphometric descriptors to species regions, and when we do, these descriptors will replace the "dummy" columns. Having these "dummy" columns from the beggining allows forward-compatibility with this change: you will be able to append the new exports to your old ones without any complications, since the number of columns will be the same.
Important !
When exporting your data, make sure that the target file is not simultaneously opened in Excel or in another application.
Excel takes hold of the file and prevents other applications from having write-access to it, so photoQuad will not be able to export the requested data. If this happens, you will receive a message saying so. Please close the target file from Excel and repeat the export.
If you find this section too technical, just skip it and follow this rule: avoid self-intersecting regions
You work with polygons, photoQuad works with pixels
Regions are not there for illustration purposes, and you will barely spend any of your time just to draw a region and look at it. Regions are actually ment to isolate a single connected group of pixels, so that the software can calculate some descriptors about that group.
The important thing to remember here is that region descriptors are calculated on connected components (i.e. contiguous pixel groups), not polygons using calculus equations.
A region's perimeter for example is not the sum of the Euclidean distances between successive polygon vertices (as you would measure it with a ruler), but is actually the summed distance between each adjoining pair of pixels around the border of the region. This distance is initially expressed in pixel units, and if the image is calibrated, the software converts it to centimeters. Another example is area. Region area is not calculated using the line integral of the polygon's planar coordinates, but is the number of pixels contained in the polygon. If the image is calibrated, the software further knows a pixel's unit area and can express region area to cm2 units.
So it all boils down to determining which pixels are included in the polygon and which are not. This is a bit more complicated than it initially seems, and the tricky part is that for self-intersecting regions, chances are that the pixel just beneath the intersection may be rejected, resulting to two regions as illustrated in the image below. Whether the problem appears on not depends on the way that a particular intersection is positioned over the pixels, but also on the image's resolution, i.e. how big the pixels are relative to the polygon.
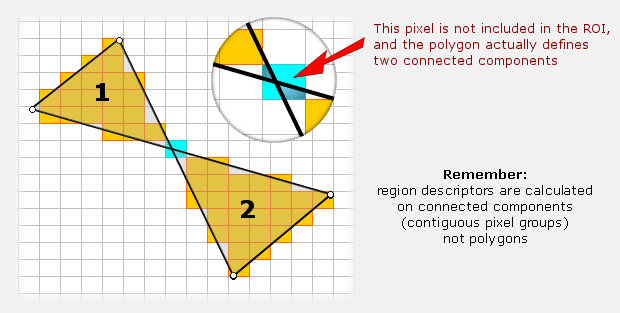
Having two (or more) regions when you started with one has some complications in terms of software programming, but the real issue here is the physical interpretation of region descriptors. If you defined a single polygon and got the perimeter of two regions, what do you make of it? You may be happy with area being the sum of the two sub-regions, but does this also apply to region centroid? And how do you treat the more advanced descriptors such as perimeter roughness?
How did we solve this
We wrote this section, and advised photoQuad users to avoid self-intersecting regions.
We programmed photoQuad to perform an internal check, and make an auto-correction in the background. If the software detects that the user-defined polygon results in more than 1 region, it incrementally "dilates" (i.e. grows) the sub-regions in 1-pixel steps until they are merged into one. To put it simple, the software adds 1 pixel around each sub-region and checks for continuity. If it fails, it adds 2 pixels and checks again. If it fails, it adds 3 pixels etc. When a contiguous group of pixels is achieved, descriptors are extracted. Usually the problem is solved in step 1, but whichever the case, differences in the descriptor results are negligible. Even a tiny region of 50x50 pixels on a 4000x3000 resolution image will be 2500 pixels, and having 2510 won't have that much of an impact.
The bottom line is that you should avoid self-intersecting regions, but even if you don't photoQuad corrects any issues in the background.
What's the difference between a region of interest (ROI) and a species region?
A species region is a ROI that has been associated to a species. Please read this section for details.
Are ROIs included in the summary report and worksheet export?
No. Only assigned species regions are considered.
Can I draw a ROI without having to import a species library?
Yes. A species library is only needed in order to assign a ROI to a species.
What happens if I try to assign a ROI, but I have not yet imported a species library?
photoQuad will automatically prompt for a custom species library, or suggest to use the embedded one.
Can I re-assign a species region during analysis?
Yes. Right-click it and select the "Re-assign to Species".
Can I reset a species region i.e. switch it back to unassigned?
Yes. Right-click it and select "Unassign and revert to ROI".
Can I assign multiple regions at once?
Yes, read this section. To do the same in a more controlled way, try this method that works quite fast: Start by drawing the necessary ROIs. Right-click one of them, select "Assign to species", and enable the "on top" checkbox in the region assignment window. Now right-click and assign ROIs consecutively.
Can I define species regions using photoQuad's image segmentation algorithm?
Yes. Use image segmentation to automatically partition the image into segments. Select the segments you prefer, and convert them to ROIs. From that point, everything works as described on this page.
Can I modify the outline of a ROI or species region during analysis?
Yes. Right-click it and select the "Break to nodes and Edit" option.
If I modify the outline of a species region, its characteristics obviously change. Do I have to force photoQuad to update the region's descriptors?
No. photoQuad automatically updates region descriptors each time the quadrat boundary, the calibration data or the region itself is modified. No matter when you request for a summary report and worksheet export, you will always get the updated information.
Can I toggle ROIs or species regions visibility on/off?
Yes. Use the corresponding checkbox in photoQuad's floating GUI.
When I right-click a region, there is an interesting "Add pocket region" option. What's this and why haven't you mentioned anything about it in the main text above?
This feature is designed to allow for internal holes inside regions, and the subsequent calculation of appropriate descriptors. The work is still under progress and will be fully functional and documented in the upcoming photoQuad version. Currently, only the graphical part is completed i.e. you can add as many pocket regions as you want, but they are ignored when parent region descriptors are calculated.
